April 29, 2019
This article is reprinted with permission from American Geophysical Union, Eos, at https://eos.org/project-updates/making-the-first-national-seafloor-habitat-map.”
Seamap Australia integrates seafloor maps with information on plant and animal habitats, environmental stressors, and resource management to create a first-of-its-kind resource.
by Vanessa Lucieer, Craig Johnson, and Neville Barrett
Imagine that the ocean could be drained to reveal the landscape of the seafloor around Australia. Now imagine that we could overlay on this landscape a map of the various seafloor types and the ways that marine animals and plants are distributed across these seafloor types. Even better, imagine being able to easily visualize all these factors in relation to resource management boundaries or factors that place stress on marine environments.
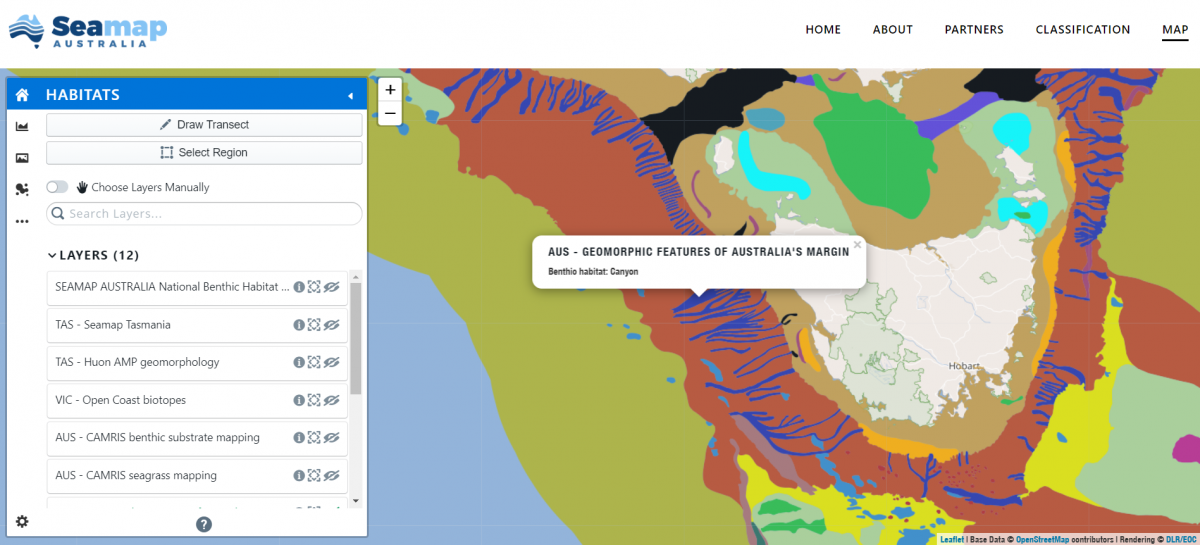
Draining the ocean isn’t possible, of course, but a large team of Australian scientists has done the next best thing. By collating spatial information on seafloor habitats from a wide range of collaborating agencies and universities, they’ve produced Seamap Australia, an interactive mapping service and database that spans the coastal marine region from the coastline to the shelf break, 200 meters below the surface of the water. The extent of the survey data represents all marine habitat surveys to 2017, comprising a total of 6.5% of Australia’s marine jurisdiction, which at 13.9 million square kilometers is the third largest in the world.
This resource makes Australia the first continent to have released a benthic marine habitat map with a singular, nationally consistent classification scheme. This information release is relevant to the current motivations of the international community as we work toward mapping the gaps in bathymetric data across the world’s oceans. Seamap Australia is a national habitat map derived from both bathymetry and associated ground truthing of biological communities and sediment composition.
Beyond bathymetry
Other organizations have produced data viewers for seafloor maps. The International Hydrographic Organization along with the U.S. National Oceanic and Atmospheric Administration (NOAA) have just released their Data Centre for Digital Bathymetry (DCDB) data viewer, just as Geological Survey Ireland and the Marine Institute have produced Integrated Mapping for the Sustainable Development of Ireland’s Marine Resource (INFOMAR). However, these viewers are solely for bathymetric data, not data classified into seafloor habitats.
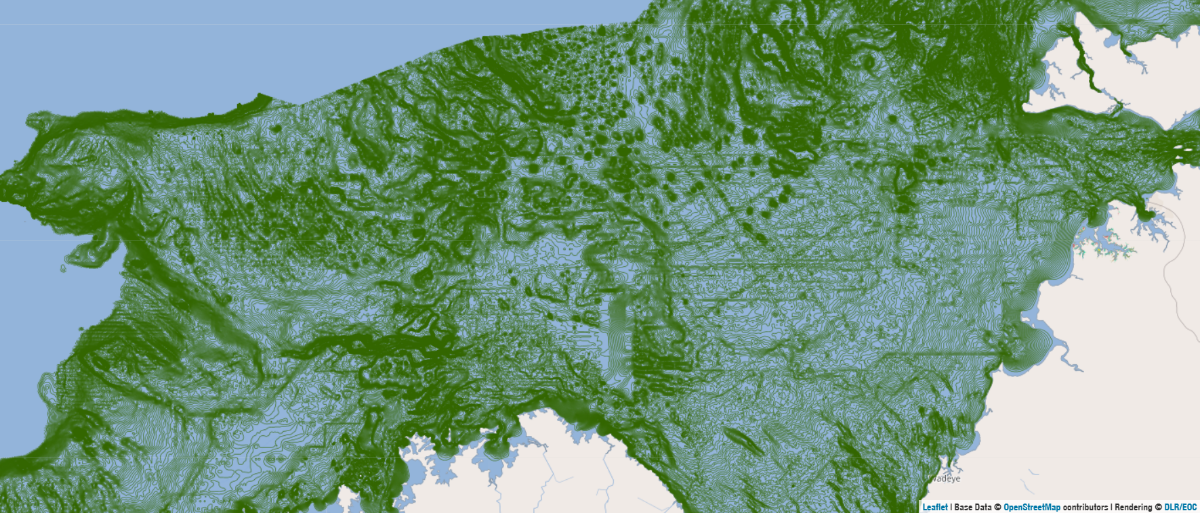
Bathymetric data are the foundation of benthic habitat mapping. From high-resolution bathymetry data, we can extract information on the surface structures and geological features of the seafloor—its geomorphology. This information, in turn, gives us clues about such seafloor habitats as reefs and sediment.
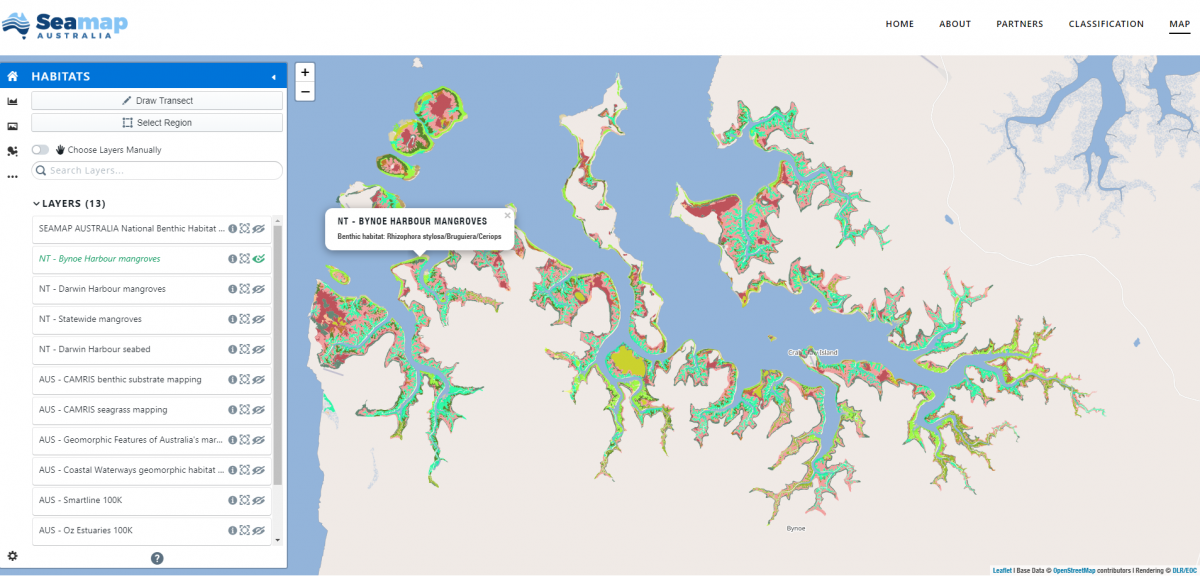
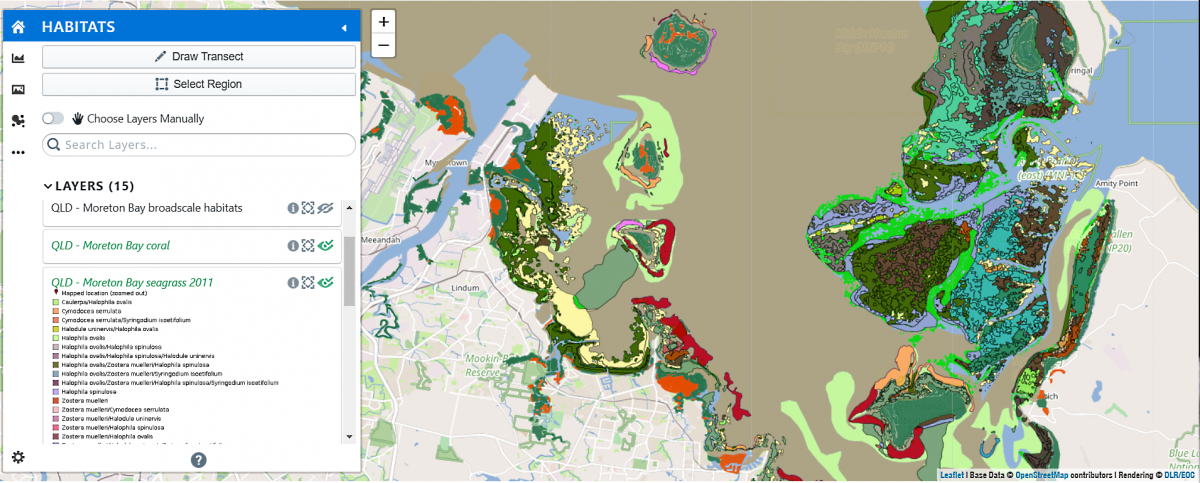
From high-resolution benthic habitat maps, environment managers can visualize where the habitats are that need protection, such as reefs and sea grasses. They can also identify areas where marine life production is at its highest.
Putting Seamap Australia to use
In the first months since its release, Seamap Australia is already being used widely, particularly by governmental agencies. These include Australian government agencies such as Parks Australia—the agency now has ready access to habitat and bathymetry data within marine parks and reserves nationwide. Feedback on government needs will help to clarify future plans to include information on threatened species and cultural values, which will be used to address future stressors.
The Australian Department of Agriculture and Water Resources uses Seamap Australia for biosecurity management in determining habitat suitability for, and distribution of, marine pest species. The National Environmental Science Program Marine Biodiversity Hub uses Seamap Australia for end-to-end delivery of data and information to meet state-of-the-environment reporting to the Australian government—an internationally accepted framework for assessing resilience, emerging risks, and outlooks for the marine environment. Seamap Australia has proven to significantly reduce the time and effort required to locate and download reliable and relevant marine spatial data.
In Australia, less than 25% of the seabed within Australia’s exclusive economic zone has been bathymetrically surveyed at high resolution. Australia is striving to coordinate its seabed mapping activities to bring government, industry, and universities together to fully use the skills, resources, and data available. Initiatives such as Seamap Australia have the capacity to develop a collaboration between the national and international community where the development of spatial analysis tools and better standards for habitat classification can be registered, assessed, and shared.
A challenging effort
Scientists faced many technological challenges in the development of Seamap Australia. Seeking and accessing available seabed habitat data were the first hurdle: The marine community needed to be encouraged to upload their spatial data into national geodatabases where they could be harvested for this project.
After clearing the first hurdle—finding the data—classifying the data was the second challenge to be solved. Not every country enjoys Australia’s level of access to resources for marine surveys, but even Australia presented some difficulty. There is no coordination of survey effort nationwide, so knowing where data have been collected was the first knowledge gap that had to be filled. Seamap Australia scientists also learned that although national geospatial agencies might produce survey data, they do not process these data to a level at which they can be used to produce maps such as habitat maps.
Expert development of a single habitat classification schema enabled us to assimilate disparate data sources of variable scale, resolution, and collection technology to create the continental-scale spatial layer. From a big data perspective, the website needed to condense petabytes of unprocessed field data into a single unified mapping layer.
The primary role of Seamap Australia was to maximize performance and usability by reducing data to a manageable size (the total collection is about 25 gigabytes). However, our success relied on overcoming competing interests of contributors, establishing a culture of data sharing, and achieving national agreement on a classification schema and the associated vocabulary.
All seafloor habitat data sets used by Seamap Australia are now publicly accessible from the platform under a Creative Commons license. We recognized the need for a central aggregation service, so we scoped the requirements for a system that would deliver a simple and intuitive visualization tool based on a distributed data model.
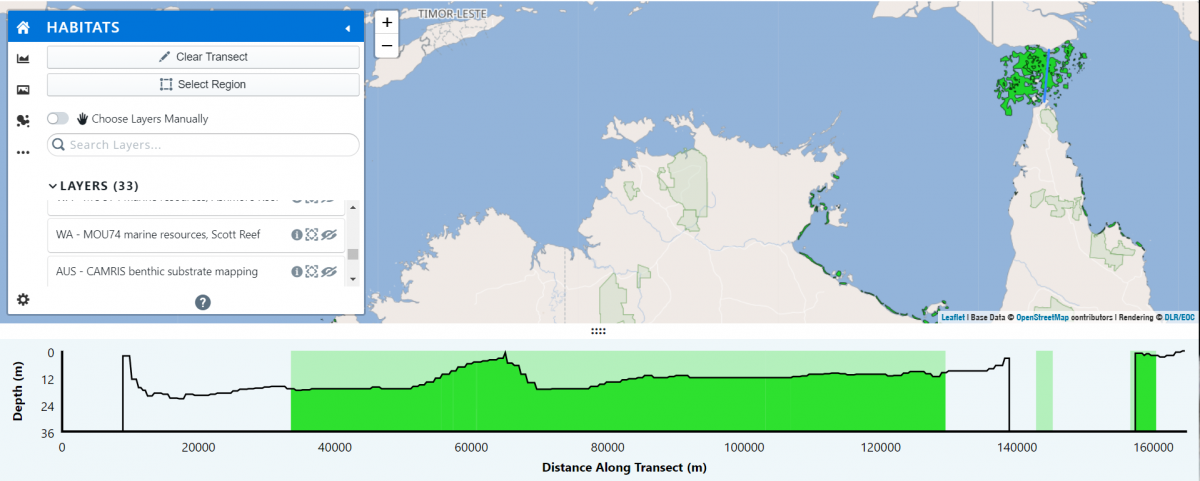
Developers considered the most relevant technology for interoperability and integration with other systems. Seamap was designed to be scalable, involving careful trade-offs around data access and computation. Technologies used to achieve performance at large scales included load balancing and caching, a stateless application architecture, and distribution across multiple hosts to reduce the impact on a single server. A custom application program interface (API) enables novel features such as construction of “on the fly” cross sections of the seabed, and it provides innovative “smart” selection of data sets most relevant at different spatial scales for download in a variety of formats.
Moving the field forward
It is widely recognized that making data findable, accessible, interoperable, and reusable (FAIR) is the way forward for research. Anyone can easily find, access, use, and share FAIR data.
Collaborative partnership with Seamap Australia will foster growth of knowledge of marine environments and ecosystems within the vast jurisdiction of the Australian marine estate. Only the future will tell whether Seamap Australia has helped to address this goal, but for this project to succeed, future surveys will need to accede to the principles of FAIR data.
National initiatives such as Seamap Australia and international initiatives such as Seabed 2030 support an environment in which the public and private sectors can come together. This type of collaboration paves the way to provide ocean science, data, and information to inform policies for a well-functioning ocean, one of the two major goals of the United Nations Decade of Ocean Science for Sustainable Development (2021–2030), which supports the 2030 Agenda for Sustainable Development.
Projects such as Seamap Australia enable new projects of national scope that are relevant in terms of scale (nationwide) and timeliness (almost live) to the United Nations Decade of Ocean Science. This type of effort is the only way that we can improve knowledge of our vast marine estate and complete the remaining 75% of Australia’s bathymetric map.
Author information
Vanessa Lucieer, Craig Johnson, and Neville Barrett, Institute for Marine and Antarctic Studies, University of Tasmania, Hobart, Australia
Citation: Lucieer, V., C. Johnson, and N. Barrett (2019), Making the first national seafloor habitat map, Eos, 100,https://doi.org/10.1029/2019EO116965. Published on 11 March 2019.
Text © 2019. The authors. CC BY 3.0
Except where otherwise noted, images are subject to copyright. Any reuse without express permission from the copyright owner is prohibited.
- Log in to post comments