May 24, 2017
 Day 10: Asher Flatt: onboard communicator
Battle ships and submarines are things that people usually think of when they think sonar, and they are not far wrong. The first use of sonar, however, was to detect icebergs back in 1906. It wasn't until World War 1 and World War 11 that sonar was reappropriated to detect enemy submarines and, with military necessity on its side, the technology made great leaps forward. Once peace had returned to the world this advanced technology was turned once more to the seafloor, not to look for submarines, but to map the land beneath the waves.
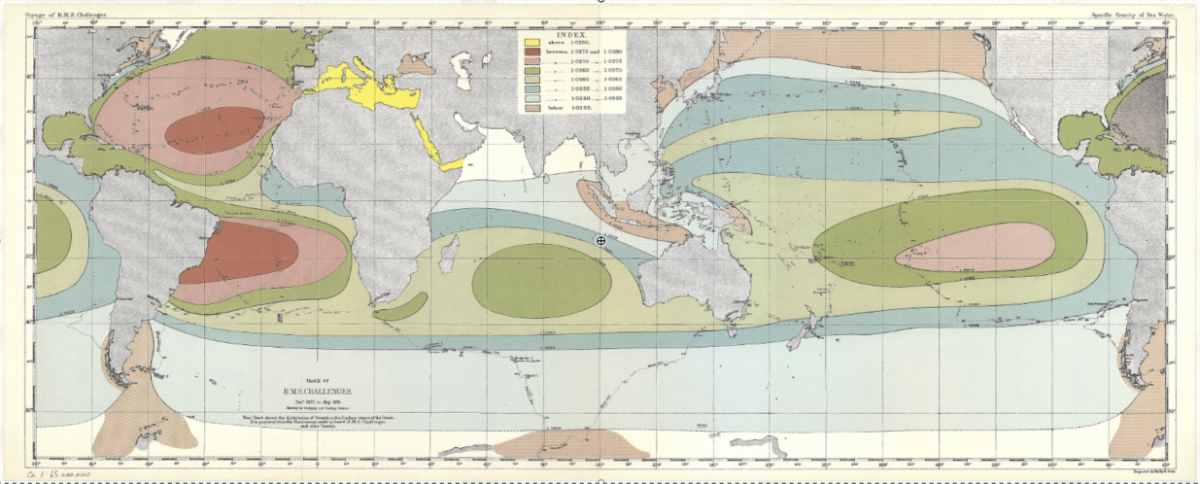
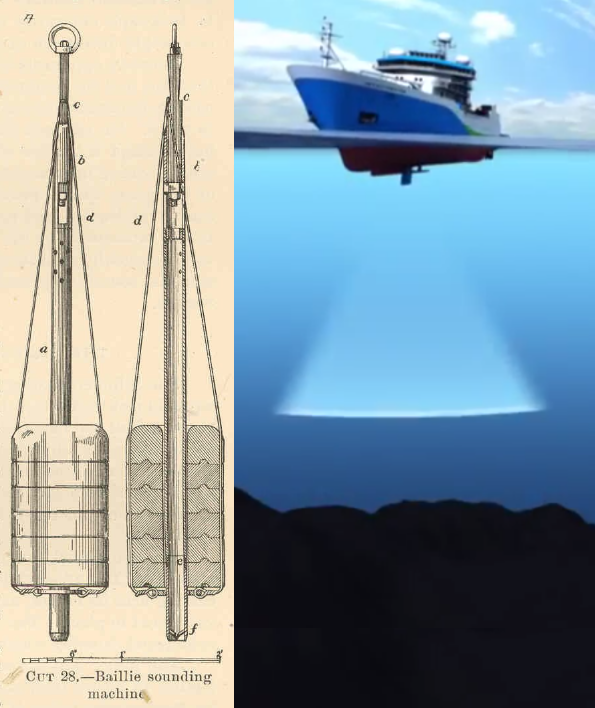
Back in the days before sonar, the only way to get an idea of ocean topography was to do ‘soundings’ with a weighted line being lowered to the seafloor. When the line slackened it had hit the bottom and an estimate of depth could be gained by measuring the amount of line used.
With the advent of sonar, there was no longer a need for long lines and manual labour: one can simply send out a wave of sound and measure how long it takes to hit the sea floor, bounce back and return to the ship. Like throwing a bouncy ball against a wall and measuring the time between it leaving your hand and you catching it again.
The composition of the seafloor can also be mapped in this way by measuring the strength of the returning sound wave. In a soft sediment, more of the sound is absorbed so the return signal will be weaker than with a hard substrate such as rock, where most of the signal will be bounced back.
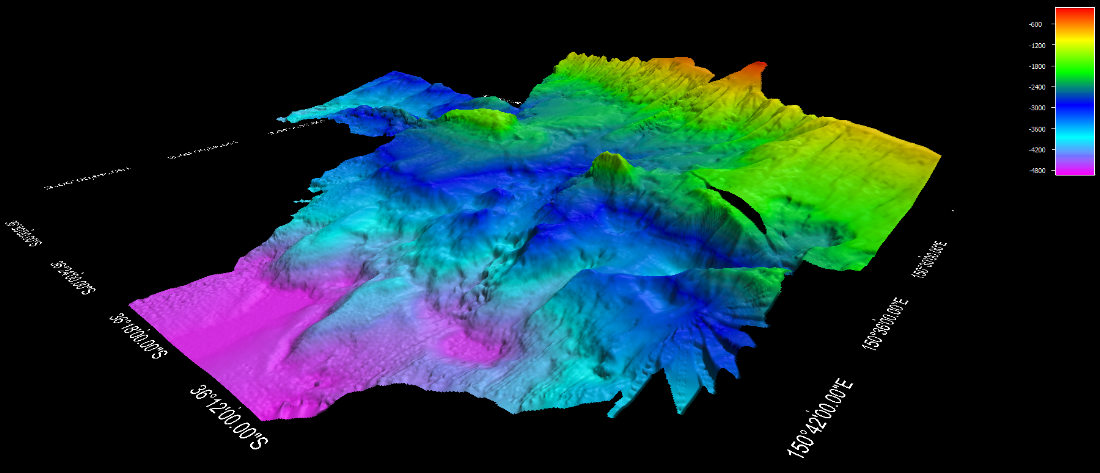
Present day sonar has progressed even further with multi-beam sonar arrays such as the swath mapper on board the CSIRO RV Investigator. This uses the same process, except instead of sending out one beam of sound it sends out many beams of sound, all at once. This allows for very accurate mapping of large areas of the sea floor, and with the magic of sonar the hidden folds and valleys of the world below the waves is slowly being revealed.
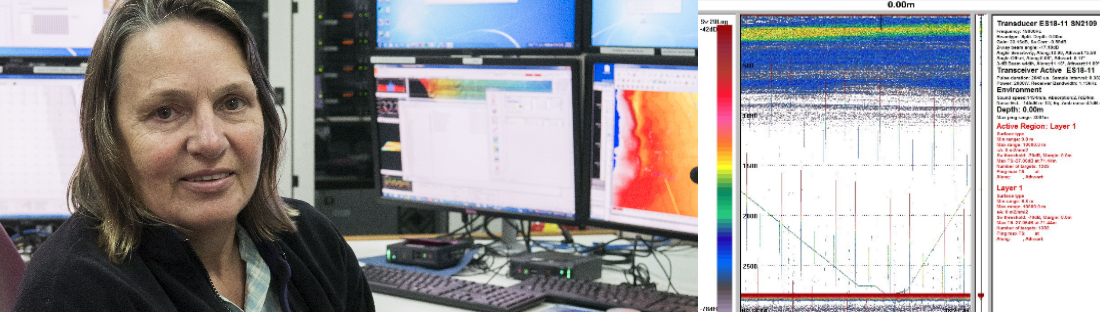
There is nothing worse than waiting five hours for a trawl net to go down 4000 metres only to hit a rock on the ocean floor. So multi-beam mapping is being used on our voyage to determine the make-up of the ocean floor below us. This lets us see where there are areas of hard rocky substrate so we can avoid these and save our gear from disaster.
Learn more about the multibeam sonar capabilities of the RV Investigator.
- Log in to post comments